For more information, see the official site: github.io
Contents
Initialize session with Trader Workstation
% initialize session with TWS
session = TWS.Session.getInstance();

% create local buffer for historical data events
[buf,lh] = TWS.initBufferForEvent(TWS.Events.HISTORICALDATA);

% connect to TWS
session.eClientSocket.eConnect('127.0.0.1',7496,0);
added interface method: TWSNotification
notification listener has been added
Server Version:71
TWS Time at connection:20141231 09:54:40 EST
Requesting historical data from IB/TWS
% create an empty stock contract
contract = com.tws.ContractFactory.GenericStockContract('FB');

% request historical data for our contract for a year w/ 1-day bars
session.eClientSocket.reqHistoricalData(1000001,contract,'20141230 16:00:00','1 Y','1 day','TRADES',1,1,false,[]); pause(0.5);
Process historical data event
Under the hood, Trader Workstation returns one bar at a time. That is, EWrapper:historicalData() is called once for each bar. Each bar associated with the request ID, 1000001 in this case, is aggregated into a single event (i.e. event.data = HashSet<com.tws.Bar>)
Retreive the historical data event from the buffer
hde = buf.get();
Convert the HashSet<Bar> into more native cell array of bars
bars = collection2cell(hde.data);
Figure out how many bars were returned
numel(bars)
ans =

   252
but could also call size() method on event.data directly without cell conversion
numel(bars) == hde.data.size()
ans =

     1
Print out bars to the screen
for i = 1:min(numel(bars),10); disp(bars{i}); end
1000001 20141107 12:00:00     75.39     75.86     75.02     75.60 177169 80295

1000001 20140102 12:00:00     54.83     55.22     54.19     54.71 428839 159633

1000001 20140228 12:00:00     69.31     69.88     67.38     68.46 593817 210923

1000001 20140724 12:00:00     76.00     76.74     74.51     74.98 1055827 373253

1000001 20141024 12:00:00     80.10     80.76     79.32     80.67 272171 122810

1000001 20141208 12:00:00     76.18     77.25     75.40     76.52 230905 108425

1000001 20140227 12:00:00     69.34     70.01     68.87     68.94 377375 142062

1000001 20140415 12:00:00     59.29     59.68     55.88     59.09 1032015 348145

1000001 20141027 12:00:00     80.74     80.80     79.76     80.28 252252 116477

1000001 20141229 12:00:00     80.56     80.96     79.71     80.02 124733 61079
Extract close and volume info from each bar
close = cellfun(@(b)b.close,bars); vol = cellfun(@(b)b.volume,bars);
Convert the string time of the bars to matlab datenum
dt = datenum(cellfun(@(b)char(b.dtstr),bars,'UniformOutput',false),'yyyymmdd HH:MM:SS');
The bars might not be in order once extracted from the HashSet
[~,indx] = sort(dt);
Now, finally, plot the data
subplot(5,1,1:3); plot(dt(indx),close(indx),'Marker','.'); xlim([min(dt),max(dt)]); datetick; grid on; ylabel('close' );
subplot(5,1,4:5); bar (dt(indx),vol  (indx)             ); xlim([min(dt),max(dt)]); datetick; grid on; ylabel('volume');
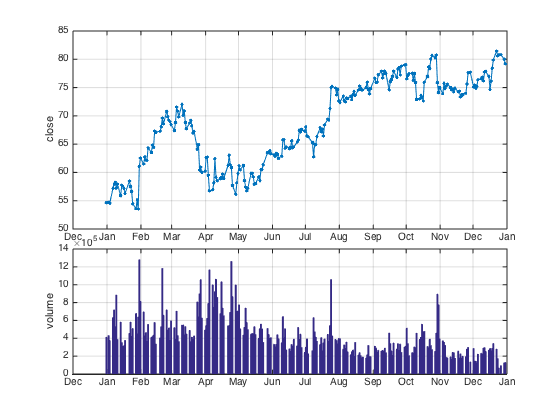
From here, it is easy to move on to candel plots and other technical indicators etc.
See Also
candle | highlow | bolling | movavg
References
Mathworks Financial Toolbox:
Matlab File Exchange:
Interactive Brokers API:
TWS@Github:
Apache Commons:
Java Docs: